The pulse of the Italian court auction market
Figures, trends and aggregate analysis from 23.159 active auctions published by 156 Italian courts on the Ministry of Justice’s Public Sales Portal. A public, free dataset updated every 6 hours.
What the data tells us today
Right now there are 23.159 active court auctions in Italy, spread across the whole country. The most active region is Sicilia (2498 aste); the court that publishes the most listings is Tribunale di UDINE (763 aste).
The dominant category is Immobili (74% del totale). The most frequent sale method is Asincrona telematica (54.6%). The prevailing price band is Fino a 25.000 € (40% delle aste).
The average discount on the appraised value is 23,0% rispetto al valore peritale: this means that, on average, auctions are offered below the price estimated by the court’s expert. This gap is where the typical investment opportunity of court auctions lies.
Market overview
Key indicators updated in real timeTrends and distribution
Last 12 months · auctions publishedTrend of published auctions
Number of new auctions published per month
Distribution by category
Active auctions by PVP macro-category
Prices and sale methods
Distribution of active auctionsDistribution by price band
Number of auctions by starting price range
Sale method
Online, synchronous, asynchronous, mixed or in-person
Average discount on the appraised value
Percentage difference between the starting price and the value estimated by the expertAverage discount by region
Top regions by discount on appraised value
Average discount by category
Differences between property, vehicles and businesses
Median price per square metre (€/m²)
Starting price ÷ stated floor area — active residential propertiesFigure calculated on the subset of active residential properties with an interpretable floor area: 3778 out of 9380 active residential auctions (coverage 40.3%). National median: €549/m². The table shows provinces with at least 10 auctions that can be valued.
| Province | Median €/m² | Auctions |
|---|---|---|
| Roma | € 1156 | 209 |
| Cosenza | € 296 | 169 |
| Torino | € 555 | 122 |
| Messina | € 478 | 112 |
| Salerno | € 517 | 93 |
| Taranto | € 471 | 90 |
| Napoli | € 921 | 90 |
| Reggio di Calabria | € 274 | 86 |
| Ragusa | € 388 | 84 |
| Foggia | € 638 | 78 |
| Alessandria | € 359 | 71 |
| Ancona | € 707 | 65 |
| Milano | € 1441 | 62 |
| Latina | € 882 | 61 |
| Pavia | € 365 | 59 |
| Agrigento | € 385 | 59 |
| Chieti | € 377 | 59 |
| Perugia | € 678 | 54 |
| Pistoia | € 894 | 53 |
| Catania | € 513 | 52 |
| Bari | € 836 | 52 |
| Firenze | € 1068 | 52 |
| Genova | € 887 | 51 |
| Palermo | € 392 | 50 |
| Pescara | € 500 | 49 |
| Bergamo | € 756 | 48 |
| Macerata | € 403 | 47 |
| Caltanissetta | € 374 | 44 |
| Pordenone | € 664 | 43 |
| Pisa | € 1415 | 43 |
| Siracusa | € 323 | 41 |
| Trapani | € 294 | 40 |
| Monza e della Brianza | € 1317 | 40 |
| Varese | € 682 | 39 |
| L'Aquila | € 452 | 39 |
| Asti | € 358 | 39 |
| Viterbo | € 423 | 38 |
| Frosinone | € 395 | 38 |
| Siena | € 1293 | 36 |
| Treviso | € 836 | 35 |
| Teramo | € 507 | 35 |
| Pesaro e Urbino | € 278 | 33 |
| Avellino | € 319 | 33 |
| Venezia | € 910 | 33 |
| Terni | € 546 | 32 |
| Potenza | € 209 | 32 |
| Caserta | € 553 | 31 |
| Campobasso | € 305 | 31 |
| Fermo | € 677 | 30 |
| Sud Sardegna | € 332 | 30 |
| Enna | € 232 | 29 |
| Imperia | € 738 | 28 |
| Benevento | € 352 | 28 |
| Rieti | € 446 | 26 |
| La Spezia | € 1004 | 26 |
| Sassari | € 792 | 25 |
| Biella | € 328 | 25 |
| Livorno | € 827 | 25 |
| Cuneo | € 616 | 24 |
| Lecce | € 542 | 23 |
| Lucca | € 670 | 23 |
| Catanzaro | € 195 | 23 |
| Cremona | € 330 | 23 |
| Barletta-Andria-Trani | € 507 | 22 |
| Brescia | € 878 | 22 |
| Arezzo | € 720 | 22 |
| Mantova | € 465 | 21 |
| Vercelli | € 447 | 20 |
| Grosseto | € 562 | 20 |
| Modena | € 1072 | 20 |
| Belluno | € 382 | 18 |
| Ravenna | € 532 | 18 |
| Rovigo | € 274 | 18 |
| Matera | € 610 | 17 |
| Padova | € 709 | 17 |
| Verona | € 1100 | 17 |
| Cagliari | € 910 | 16 |
| Oristano | € 988 | 16 |
| Vibo Valentia | € 232 | 16 |
| Vicenza | € 478 | 16 |
| Novara | € 608 | 16 |
| Brindisi | € 398 | 15 |
| Aosta | € 903 | 15 |
| Savona | € 989 | 14 |
| Nuoro | € 456 | 14 |
| Como | € 646 | 13 |
| Prato | € 1198 | 13 |
| Crotone | € 352 | 13 |
| Piacenza | € 618 | 12 |
| Ascoli Piceno | € 569 | 11 |
| Forlì-Cesena | € 1336 | 10 |
| Massa-Carrara | € 451 | 10 |
Liquidity thermometer
How long a property stays on the market at auction, province by provinceMedians over 6202 property chains that left the market (proxy indicator: the official outcome is not published by the PVP): nationally, 2.2 months from first publication to exit, median round 1.0. 2.9% of the 12942 chains active today have been on the market for over 12 months.
| Province | Chains that left | Months on the market | Exit round | Active for over 12 months |
|---|---|---|---|---|
| Roma | 289 | 2.3 | 1.0º | 1.8% |
| Macerata | 266 | 1.8 | 1.0º | 11.5% |
| Perugia | 194 | 2.3 | 1.0º | 4.0% |
| Reggio di Calabria | 187 | 2.1 | 1.0º | 6.4% |
| Cosenza | 175 | 2.9 | 1.0º | 10.4% |
| Salerno | 168 | 2.5 | 1.0º | 3.0% |
| Palermo | 144 | 2.3 | 1.0º | 2.0% |
| Torino | 138 | 2.2 | 1.0º | 0.3% |
| Messina | 136 | 2.2 | 1.0º | 6.9% |
| Fermo | 135 | 2.2 | 1.0º | 3.6% |
| Bari | 118 | 3.4 | 1.0º | 5.1% |
| Ancona | 114 | 2.1 | 1.0º | 2.3% |
| Catanzaro | 108 | 2.2 | 1.0º | 7.5% |
| Benevento | 107 | 2.1 | 1.0º | 6.7% |
| Siracusa | 103 | 2.6 | 1.0º | 1.6% |
Vehicles: market exits
How long vehicles stay on sale at auction, brand by brandMedians over 787 chains of lots with a recognised brand that left the market (proxy indicator: the official outcome is not published by the PVP): median exit round 1.0, median cumulative change −0.0%, 1.2 months on the market. 99.6% of the 762 exits with a known history leave at the 1st attempt.
| Brand | Chains that left | Exit round | Cumulative reduction | Months on the market | Exits at 1st attempt |
|---|---|---|---|---|---|
| Fiat | 153 | 1.0º | −0.0% | 1.2 | 100.0% |
| Iveco | 79 | 1.0º | −0.0% | 1.2 | 100.0% |
| Mercedes-Benz | 60 | 1.0º | −0.0% | 1.2 | 100.0% |
| Renault | 58 | 1.0º | −0.0% | 1.4 | 98.3% |
| Ford | 30 | 1.0º | −0.0% | 1.2 | 100.0% |
| Scania | 30 | 1.0º | −0.0% | 1.2 | 100.0% |
| Opel | 26 | 1.0º | −0.0% | 1.2 | 96.2% |
| BMW | 22 | 1.0º | −0.0% | 1.3 | 100.0% |
| Nissan | 22 | 1.0º | −0.0% | 1.2 | 100.0% |
| Peugeot | 21 | 1.0º | −0.0% | 1.3 | 95.2% |
| Audi | 20 | 1.0º | −0.0% | 1.3 | 100.0% |
| Volkswagen | 19 | 1.0º | −0.0% | 1.4 | 100.0% |
| Citroën | 18 | 1.0º | −0.0% | 1.1 | 100.0% |
| Honda | 16 | 1.0º | −0.0% | 1.4 | 100.0% |
| DAF | 14 | 1.0º | −0.0% | 1.2 | 100.0% |
By vehicle type
| Type | Chains that left | Exit round | Cumulative reduction | Months on the market | Exits at 1st attempt |
|---|---|---|---|---|---|
| Auto | 353 | 1.0º | −0.0% | 1.2 | 99.1% |
| Camion | 249 | 1.0º | −0.0% | 1.2 | 100.0% |
| Moto | 56 | 1.0º | −0.0% | 1.3 | 100.0% |
| Furgoni | 48 | 1.0º | −0.0% | 1.2 | 100.0% |
| Mezzi d'opera | 20 | 1.0º | −0.0% | 1.2 | 100.0% |
| Mezzi agricoli | 14 | 1.0º | −0.0% | 1.3 | 100.0% |
“Leaving the market” = no republication of the chain observed (the official outcome is not published by the PVP). Cumulative reduction = from the first to the last starting price observed. Brands with fewer than 10 exits are not published.
Document transparency
How complete the documents published with the sales areOut of 23159 active lots surveyed, 54.7% have the complete basic set of documents — appraisal report, notice of sale and order published together with the lot.
| Court | Lots surveyed | Complete basic set | Share |
|---|---|---|---|
| Tribunale di UDINE | 763 | 57 | 7.5% |
| Tribunale di ROMA | 656 | 152 | 23.2% |
| Tribunale di MILANO | 535 | 324 | 60.6% |
| Tribunale di TORINO | 431 | 315 | 73.1% |
| Tribunale di COSENZA | 422 | 325 | 77.0% |
| Tribunale di CAGLIARI | 410 | 97 | 23.7% |
| Tribunale di SIRACUSA | 402 | 343 | 85.3% |
| Tribunale di PERUGIA | 378 | 310 | 82.0% |
| Tribunale di FERMO | 374 | 312 | 83.4% |
| Tribunale di CATANIA | 374 | 139 | 37.2% |
| Tribunale di FIRENZE | 364 | 176 | 48.4% |
| Tribunale di SIENA | 349 | 135 | 38.7% |
| Tribunale di BRESCIA | 341 | 24 | 7.0% |
| Tribunale di BARI | 334 | 82 | 24.6% |
| Tribunale di MACERATA | 333 | 110 | 33.0% |
“Basic set” = appraisal report + notice of sale + order among the attachments published on the PVP. Their presence is detected automatically from the attachments: it is not a judgement on the content of the documents or on the work of the court offices. Courts with fewer than 30 lots surveyed are not published.
Unsold attempts
Auctions with at least one unsold attempt in their history
Auctions with unsold attempts
16315
The PVP does not publish successful sale outcomes (award, final price): we only count the unsold attempts observed in the history of republications. An award rate cannot be calculated from public sources.
Top 10 provinces by auction volume
Where the opportunities are concentrated| # | Province | Active auctions | Share | |
|---|---|---|---|---|
| 1 | Roma (RM) | 1.012 | Explore → | |
| 2 | Udine (UD) | 768 | Explore → | |
| 3 | Perugia (PG) | 609 | Explore → | |
| 4 | Torino (TO) | 593 | Explore → | |
| 5 | Cosenza (CS) | 506 | Explore → | |
| 6 | Milano (MI) | 484 | Explore → | |
| 7 | Catania (CT) | 458 | Explore → | |
| 8 | Napoli (NA) | 455 | Explore → | |
| 9 | Siracusa (SR) | 379 | Explore → | |
| 10 | Macerata (MC) | 367 | Explore → |
Courts with the most active auctions
Top 15 by publication volume| # | Court | Auctions | Average discount | Share | |
|---|---|---|---|---|---|
| 1 | Tribunale di UDINE | 763 | −83,6% | Go → | |
| 2 | Tribunale di ROMA | 656 | −18,4% | Go → | |
| 3 | Tribunale di MILANO | 535 | −11,2% | Go → | |
| 4 | Tribunale di TORINO | 431 | −6,7% | Go → | |
| 5 | Tribunale di COSENZA | 422 | −35,6% | Go → | |
| 6 | Tribunale di CAGLIARI | 410 | −43,9% | Go → | |
| 7 | Tribunale di SIRACUSA | 402 | −27,1% | Go → | |
| 8 | Tribunale di PERUGIA | 378 | −26,7% | Go → | |
| 9 | Tribunale di CATANIA | 374 | −15,8% | Go → | |
| 10 | Tribunale di FERMO | 374 | −32,0% | Go → | |
| 11 | Tribunale di FIRENZE | 364 | −25,6% | Go → | |
| 12 | Tribunale di SIENA | 349 | −9,4% | Go → | |
| 13 | Tribunale di BRESCIA | 341 | −16,9% | Go → | |
| 14 | Tribunale di BARI | 334 | −9,1% | Go → | |
| 15 | Tribunale di MACERATA | 333 | −25,8% | Go → |
Auctions with the biggest discount on the appraised value
The 10 most aggressive opportunities right now
Without photos
−90%
VIA BARI 2, 90047, Partinico, Palermo
Lotto A Appartamento di piano quarto sito in Partinico, Via Bari,...
€ 13.634
€ 136.189
Without photos
−90%
Via Stefano Bongioni, 13, 23030 Villa di...
casa albergo per anziani
€ 311.180
€ 3.108.282
Without photos
−89%
via Achille Grandi n. 159, 41019, Soliera, Modena
Piena proprietà per l'intero di porzione di fabbricato...
€ 44.824
€ 425.000
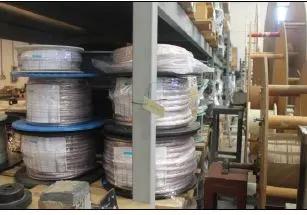 −89%
Via Walter Tobagi, 7, 24035 Curno BG,...
Rimanenze di magazzino costituite da accessori e componentistica...
€ 29.656
€ 281.180
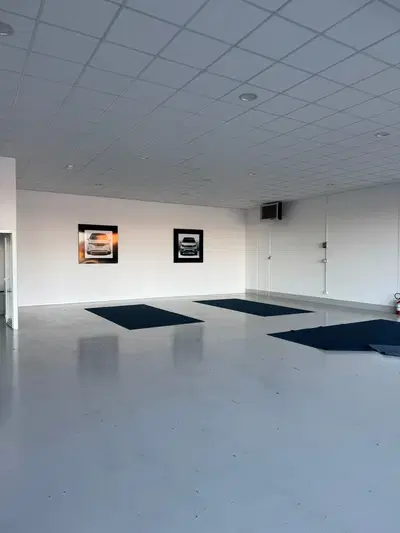 −89%
., 30026, Portogruaro, Venezia
Lotto UNICO - Attrezzature gomme - Attrezzature collaudo - ...
€ 6.000
€ 56.480
Without photos
−89%
VIA PRIELLII, 15030, Rosignano...
In Comune di Rosignano Monferrato, Via Prielli, complesso...
€ 44.438
€ 405.215
 −89%
Via Picena, 12, 66100 Chieti CH, Italia,...
Immobile sito nel Comune di Chieti, alla Via Picena n. 12
€ 133.120
€ 1.189.300
Without photos
−88%
Via Mariano IV n. 9, 07020, Alà dei Sardi, Sassari
Piena Proprietà – Quota: 1/1 fabbricato in Comune di Alà dei...
€ 50.780
€ 430.000
 −88%
Località Regione Carana, 07025, Luras, Sassari
Complesso immobiliare a destinazione turistico-ricettiva o...
€ 891.645
€ 7.514.770
Latest auctions published
Fresh listings from the Public Sales Portal
via Arno , 80034, Marigliano, Napoli
Autoveicolo Fiat Scudo colore bianco•targa: FW296KN;•telaio:...
€ 1.125

Frazione Gad, via della Cappella 11,...
in Comune di OULX, frazione Gad, via della Cappella 11, alloggio...
€ 99.000
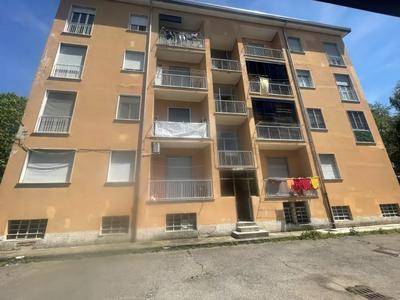
Via Stelvio, 21, 20812 Limbiate MB,...
LIMBIATE (MB) - VIA STELVIO, 21 - VENDITA TELEMATICA ASINCRONA...
€ 40.000
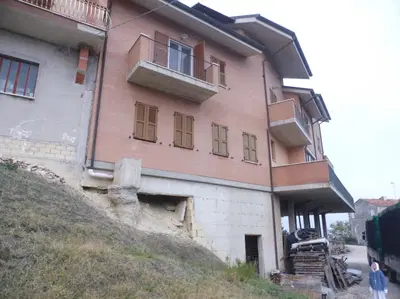
contrada Solagna 4, 63831, Rapagnano, Fermo
Diritti pari ad 1/1 di piena proprietà su appartamento con...
€ 55.637
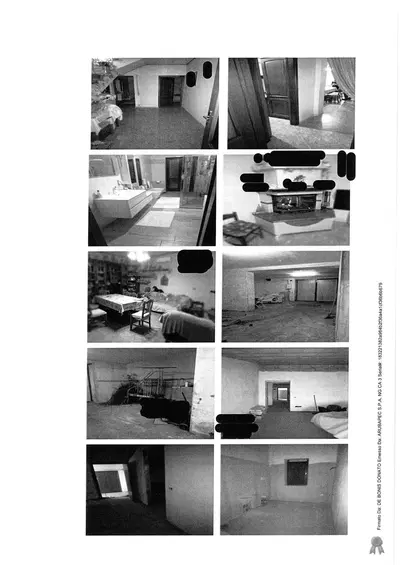
Località Valle Della Pietra n.7, 85051,...
Piena proprietà del fabbricato sito in Bella alla Località Valle...
€ 37.688
−44%
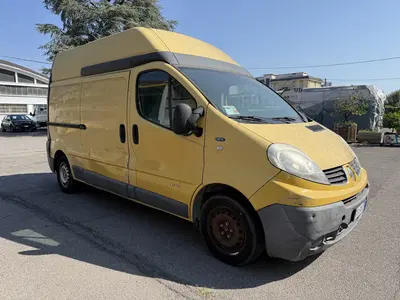
AUTOCARRO RENAUTL TRAFIC TG. DS161FZ ANNO 2008 TELAIO...
€ 1.843

MOTOCICLO KEEWAY K-LIGHT 125 TG. EY40640 ANNO 2022 TELAIO...
€ 1.843
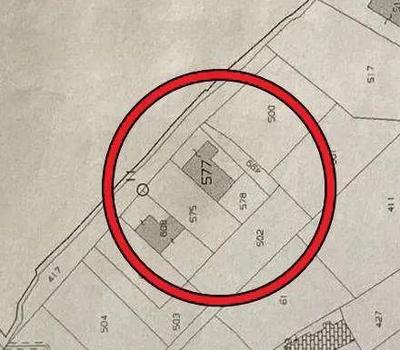
Contrada Bombaconi, 89043, Grotteria,...
Diritto di piena proprietà relativo: appartamento posto al PT,...
€ 58.721
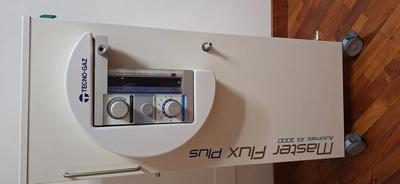
Via Giovanni XXIII n. 42, 80035, Nola, Napoli
Apparecchio per sedazione cosciente:•marca/modello: “Master Flux...
€ 4.500
Explore the dataset
Browse auctions by dimensionWant to cite this data?
Dated, immutable editions with a downloadable CSVThis dashboard updates continuously. For citations in articles, theses and research, use a dated edition: a snapshot that never changes, with a stable permalink and a CSV of aggregate data only (CC BY 4.0 licence with attribution to addicta.it). Latest edition: 30 settembre 2026 · all editions.
Embed this data on your site
Free live widget, with a source link to addictaCopy this code and paste it into your site or blog: it will show the updated figures for court auctions in Italy, with attribution to addicta. Widget preview.
Frequently asked questions
Answers based on live data
In Italia ci sono attualmente 23.159 aste giudiziarie attive, distribuite su 20 regioni e 156 tribunali. Il dato è aggiornato in tempo reale dal Portale delle Vendite Pubbliche del Ministero della Giustizia (pvp.giustizia.it) ogni 6 ore.
Il valore totale a base d'asta delle procedure attive in Italia è di 3,0 miliardi di euro. Si tratta del prezzo di partenza ufficiale fissato dal giudice: il valore peritale è generalmente più alto, ed è proprio questa differenza che genera lo sconto medio del 23,0% rispetto al mercato.
Lo sconto medio rispetto al valore peritale è del 23,0% in Italia, ma può raggiungere il 50-60% nelle aste deserte rilanciate più volte. Lo sconto effettivo dipende dalla zona, dalla tipologia del bene e dal numero di rilanci precedenti.
Un'asta giudiziaria è una vendita pubblica di beni mobili o immobili ordinata da un tribunale nell'ambito di una procedura esecutiva (pignoramento), fallimentare o concorsuale. La gestisce un delegato alla vendita (notaio, avvocato o commercialista) e si svolge sul Portale delle Vendite Pubbliche del Ministero della Giustizia.
Le aste telematiche si svolgono interamente online tramite gestori autorizzati dal Ministero della Giustizia (D.M. 26 febbraio 2015 n. 32). Per partecipare servono SPID o CIE, una marca da bollo digitale e un deposito cauzionale tramite bonifico. Esistono tre sotto-modalità: sincrona (rilanci in tempo reale), asincrona (rilanci nell'arco di giorni) e mista (offerta cartacea + rilanci telematici).
La regione con più aste attive è Sicilia con 2.498 aste. Seguono Lombardia (2.494), Lazio (1.766), Piemonte (1.560). Su addicta puoi esplorare le aste giudiziarie regione per regione.
L'asta sincrona si svolge in una finestra temporale breve (tipicamente 1 ora) con rilanci in tempo reale. L'asta asincrona consente rilanci diluiti nell'arco di più giorni (tipicamente 2-3). L'asta mista combina offerta cartacea presentata in tribunale e rilanci successivi sul portale telematico. Tutte tre sono disciplinate dal D.M. 32/2015.
Per partecipare devi: (1) leggere la perizia integrale e l'avviso di vendita, (2) versare il deposito cauzionale (10% del prezzo base, tramite bonifico), (3) presentare l'offerta entro la scadenza con marca da bollo da 16 €, (4) essere identificato con SPID o CIE per le aste telematiche. Il consulto di un professionista esperto è fortemente consigliato.
What is the Court Auction Observatory
The Italian Court Auction Observatory is addicta’s public dataset that collects, normalises and aggregates in real time all the listings published on the Ministry of Justice’s Public Sales Portal. The aim is to give investors, professionals, researchers and citizens an aggregate, readable view of the market for forced, bankruptcy and insolvency sales in Italy.
The data is updated every 6 hours and includes the number of active auctions, total starting price value, average discount on the appraised value, geographical distribution by region and province, breakdown by asset category (property, vehicles, businesses, movable goods), monthly publication trends, top courts by volume and the most frequent sale methods.
How to use the data
All the figures shown on this page are also available in JSON format through the public endpoint
/stats/market. The dataset is free, with no authentication, under a Creative Commons BY 4.0 licence: you can cite it in articles, research and analyses by stating “source: addicta Observatory — pvp.giustizia.it”.
For more granular analyses (by province, category, court or sale method) use the dedicated hubs, which show active auctions updated in real time together with specific aggregate data.
Find out more
If you want to better understand how Italian court auctions work, see our guides section with in-depth articles on ordinary and bankruptcy procedures, bidding methods, calculating ancillary costs and pre-auction checklists. For technical terms, the glossary offers clear definitions of all the key concepts.
Stay up to date on the data
Free monthly newsletter with the updated data, trends and the most active provinces of the month. No spam, unsubscribe whenever you like.